We envision a sustainable environment that supports the health of all human and natural communities in the Kansas City region.
Heartland Conservation Alliance
Our Mission
The Heartland Conservation Alliance works with partners to protect, connect, and restore the Blue River watershed and its urban greenspaces for the benefit and enjoyment of all.
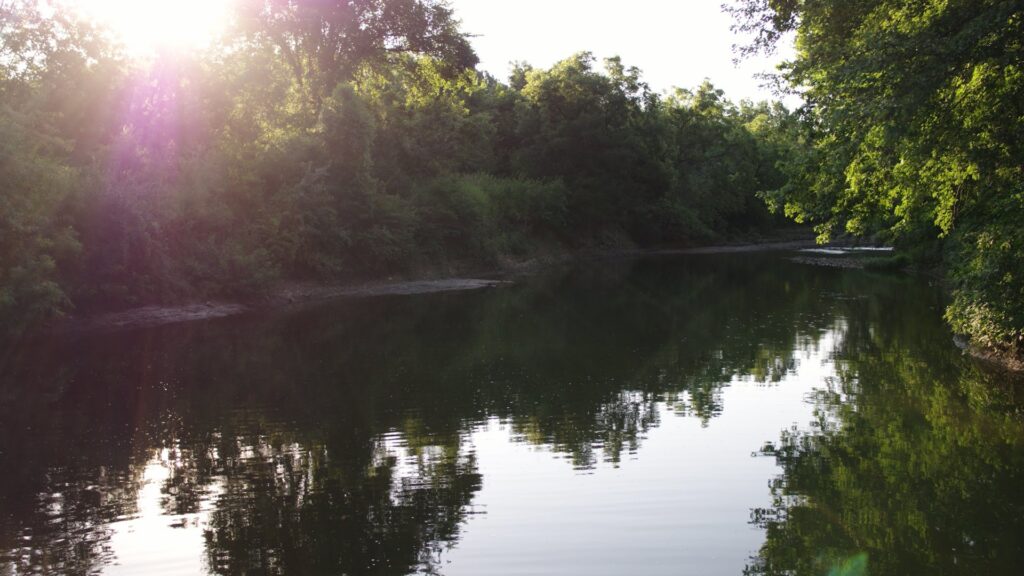
The Blue River
The Blue River is Kansas City’s river. It begins in Kansas and flows 42 miles across Kansas and Missouri into the heart of the Metro before it meets the Missouri River. The Blue River has many tributaries that have their own local importance including Brush, Indian, Tomahawk, Coffee, Wolf and Camp Branch Creeks. The Blue River runs through suburban and urban neighborhoods, industrial areas, brownfields, wetlands and forest.
The Blue River is a regional asset with great potential, but it is currently underused.
Heartland Conservation Alliance is committed to restoring and protecting this valuable natural resource, and engaging communities throughout the Blue River Watershed.